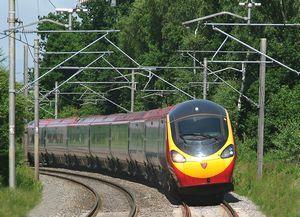
The metering equipment was fitted in August 2007, and in the five months to the end of January 2008 the average proportion of energy consumed that was returned by regeneration was 16·8%.
The project saw metering equipment and a data logger installed in each of the two transformer cars in the Pendolino trainset. A combined GPS receiver/GSM aerial on top of the car transmits information from the meters to analysis specialist EnergyICT's data warehouse. It also provides train location.
Consumption is recorded in 5 min blocks. In addition to measuring power consumed, the meters record separately the amount of energy exported to the overhead line when regenerative braking is in use. With the meters running continuously, power consumption is also recorded during station layovers and on depot.
As Table I shows, around 10% of total energy is consumed outside revenue-earning service, with 6% used when the train is on depot. Studies had already identified the potential for energy saving in depots and the results from the trainset have confirmed this.
| Table I. Allocation of energy consumption by No 390 049 over 20 consecutive weekdays | |||||
|---|---|---|---|---|---|
| Energy, MWh | % regenerated | % of total | |||
| Consumed | Regenerated | Net | |||
| In traffic | 444·6 | 81·9 | 362·7 | 18·4 | 89·4 |
| Empty stock workings | 11·1 | 2·0 | 9·1 | 17·8 | 2·2 |
| Terminal layovers | 9·1 | - | 9·1 | - | 2·3 |
| On depot | 24·6 | - | 24·6 | - | 6·1 |
| Total | 489·4 | - | 405·5 | - | - |
For example, during the first week in October 2007, the average consumption with the train stabled overnight was between 11·0 kWh and 15·5 kWh per 5 min block. During a cold spell in November, the range was 15·3 kWh to 21·4 kWh - roughly 50% more. Reducing the temperature setting of the air-conditioning and switching to recirculated air, as opposed to heating fresh air, could show significant energy savings across the Pendolino fleet.
It has also proved possible to estimate hotel power requirements in service. Preliminary calculations suggest that around 10% of the gross energy consumed in traffic is taken up by heating and air-conditioning and other onboard services.
While driving techniques can obviously influence energy requirements, analysis to date has shown little correlation between late running or the number of station stops and energy consumption. Table II is based on 70 journeys made by No 390 049 over a four-week period. Intermediate stopping patterns varied on each route, from as many as 11 between London and Glasgow to only two.
| Table II. Energy consumption by route, kWh/km | |||
|---|---|---|---|
| London to | Max | Min | Average |
| Birmingham | 15·3 | 13·8 | 14·4 |
| Wolverhampton | 15·8 | 12·4 | 13·7 |
| Manchester | 16·5 | 11·9 | 13·7 |
| Liverpool | 15·6 | 12·5 | 13·9 |
| Glasgow | 15·3 | 13·8 | 14·4 |
It would be possible to examine the link between driving techniques and energy consumption in more detail by reducing the data-logging block time from 5 min to 1 min. If advice on energy-conscious driving could bring the most energy-intensive journeys in Table II down to the average, consumption could be cut by 2% to 3%.
Table III shows the savings achieved through regeneration during the first five months of the trials. The final column shows the value of the regenerated energy, based on the UK's Moderately Large User rate of £0·062/kWh.
Based on the study, regenerative braking is worth about £7 000 per month per train. In practice, this 'saving' is already reflected in NR's existing 16·5% discount on the electricity tariff for trains equipped with regenerative braking.
| Table III. Energy consumed by No 390 049 and cost | ||||
|---|---|---|---|---|
| Month | Energy consumed MWh | Energy regenerated MWh | Regeneration | Saving |
| September | 622·3 | 110·1 | 17·7% | £6826 |
| October | 725·6 | 128·9 | 17·8% | £7992 |
| November | 680·6 | 110·9 | 16·3% | £6876 |
| December | 634·6 | 99·2 | 15·6% | £6150 |
| January | 689·8 | 112·4 | 16·3% | £6969 |
| Total | 3 352·9 | 561·5 | 16·7% | £34813 |

